MSI X99S MPower Review: Sting Like a Bee
by Ian Cutress on February 17, 2015 9:00 AM EST- Posted in
- Motherboards
- Intel
- MSI
- Overclocking
- X99
System Performance
Power Consumption
Power consumption was tested on the system while in a single MSI GTX 770 Lightning GPU configuration with a wall meter connected to the OCZ 1250W power supply. This power supply is Gold rated, and as I am in the UK on a 230-240 V supply, leads to ~75% efficiency > 50W, and 90%+ efficiency at 250W, suitable for both idle and multi-GPU loading. This method of power reading allows us to compare the power management of the UEFI and the board to supply components with power under load, and includes typical PSU losses due to efficiency. These are the real world values that consumers may expect from a typical system (minus the monitor) using this motherboard.
While this method for power measurement may not be ideal, and you feel these numbers are not representative due to the high wattage power supply being used (we use the same PSU to remain consistent over a series of reviews, and the fact that some boards on our test bed get tested with three or four high powered GPUs), the important point to take away is the relationship between the numbers. These boards are all under the same conditions, and thus the differences between them should be easy to spot.
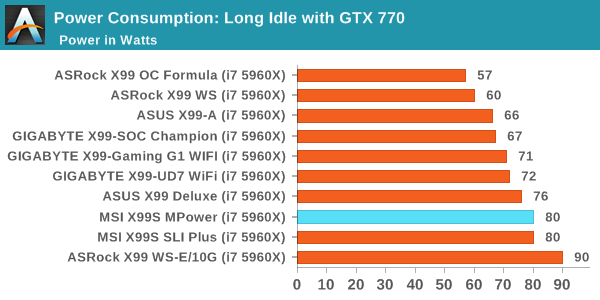
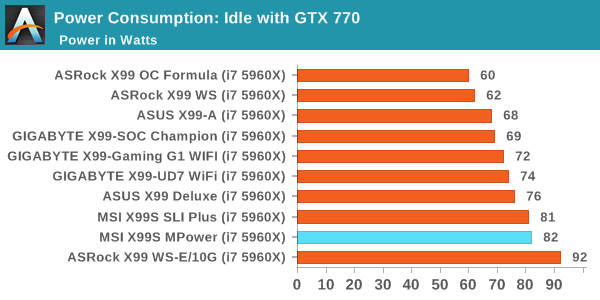
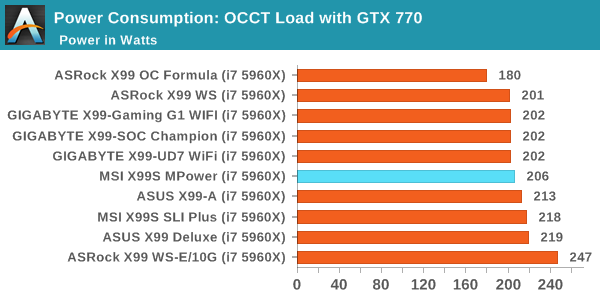
Idle power numbers are very high for the MPower, matching the SLI Plus – I’m not too sure what exactly Is going on there. Despite that, the load numbers bring it back into the ~200W category of X99, giving one of the smallest idle-to-load deltas.
Windows 7 POST Time
Different motherboards have different POST sequences before an operating system is initialized. A lot of this is dependent on the board itself, and POST boot time is determined by the controllers on board (and the sequence of how those extras are organized). As part of our testing, we look at the POST Boot Time using a stopwatch. This is the time from pressing the ON button on the computer to when Windows 7 starts loading. (We discount Windows loading as it is highly variable given Windows specific features.)
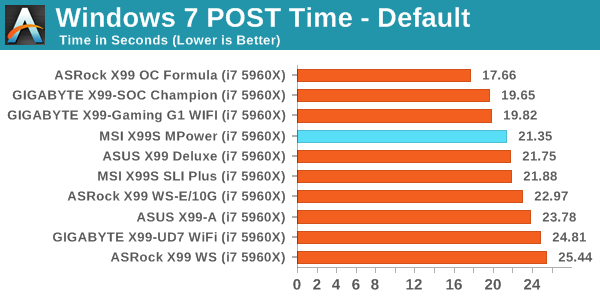
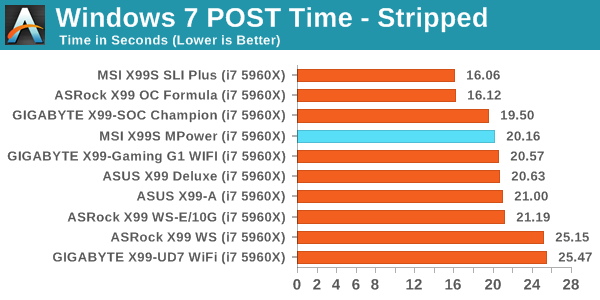
20 to 25 seconds is the ballpark for X99, and the X99S MPower fits in at just over 21.
Rightmark Audio Analyzer 6.2.5
Rightmark:AA indicates how well the sound system is built and isolated from electrical interference (either internally or externally). For this test we connect the Line Out to the Line In using a short six inch 3.5mm to 3.5mm high-quality jack, turn the OS speaker volume to 100%, and run the Rightmark default test suite at 192 kHz, 24-bit. The OS is tuned to 192 kHz/24-bit input and output, and the Line-In volume is adjusted until we have the best RMAA value in the mini-pretest. We look specifically at the Dynamic Range of the audio codec used on board, as well as the Total Harmonic Distortion + Noise.
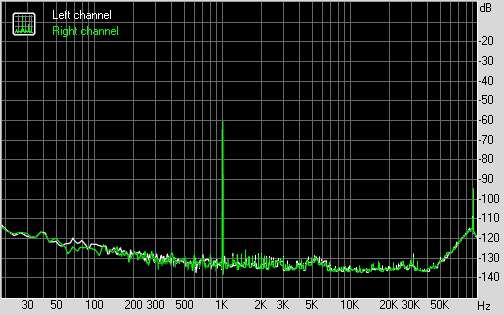
Dynamic Range of MSI X99S MPower
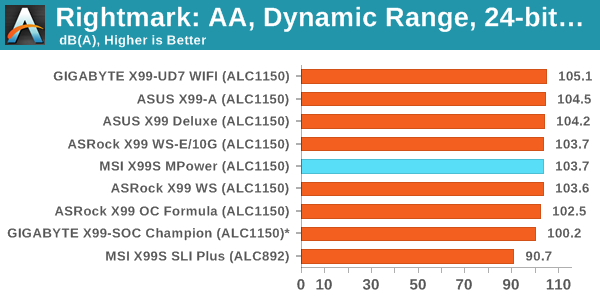
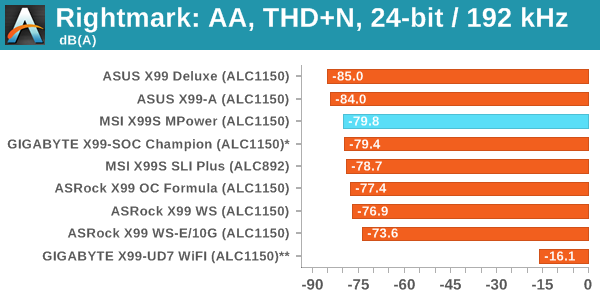
Audio results are good, with the system scoring over 103 dB on dynamic range but falling a little short of -80 dB on SNR.
USB Backup
For this benchmark, we transfer a set size of files from the SSD to the USB drive using DiskBench, which monitors the time taken to transfer. The files transferred are a 1.52 GB set of 2867 files across 320 folders – 95% of these files are small typical website files, and the rest (90% of the size) are small 30 second HD videos. In an update to pre-Z87 testing, we also run MaxCPU to load up one of the threads during the test which improves general performance up to 15% by causing all the internal pathways to run at full speed.
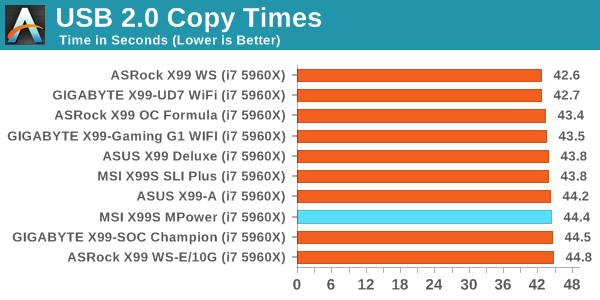
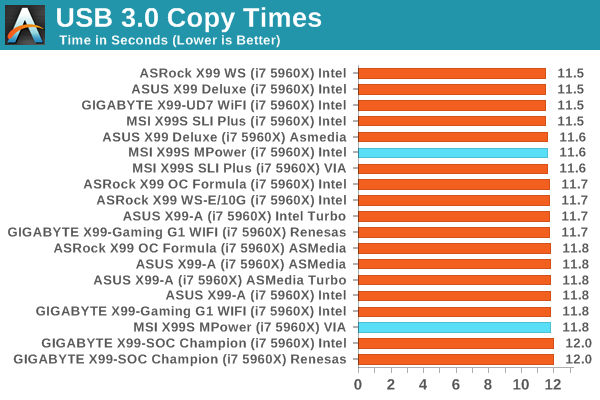
USB 2.0 speed comes in a little slow compared to the rest but the USB 3.0 speed on the PCH points is better than average.
DPC Latency
Deferred Procedure Call latency is a way in which Windows handles interrupt servicing. In order to wait for a processor to acknowledge the request, the system will queue all interrupt requests by priority. Critical interrupts will be handled as soon as possible, whereas lesser priority requests such as audio will be further down the line. If the audio device requires data, it will have to wait until the request is processed before the buffer is filled.
If the device drivers of higher priority components in a system are poorly implemented, this can cause delays in request scheduling and process time. This can lead to an empty audio buffer and characteristic audible pauses, pops and clicks. The DPC latency checker measures how much time is taken processing DPCs from driver invocation. The lower the value will result in better audio transfer at smaller buffer sizes. Results are measured in microseconds.
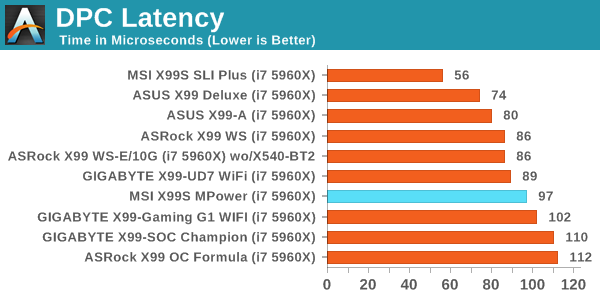
Under 100 microseconds is a good result for the MSI X99S MPower.


12 Comments
View All Comments
SantaAna12 - Monday, February 23, 2015 - link
An overclocking review with no side by side brand comparison?Really?
theduckofdeath - Tuesday, March 10, 2015 - link
It reminds me that I really have to get started on reading Metro 2034... :D