SanDisk Ultra II (240GB) SSD Review
by Kristian Vättö on September 16, 2014 2:00 PM ESTAnandTech Storage Bench 2013
Our Storage Bench 2013 focuses on worst-case multitasking and IO consistency. Similar to our earlier Storage Benches, the test is still application trace based – we record all IO requests made to a test system and play them back on the drive we are testing and run statistical analysis on the drive's responses. There are 49.8 million IO operations in total with 1583.0GB of reads and 875.6GB of writes. I'm not including the full description of the test for better readability, so make sure to read our Storage Bench 2013 introduction for the full details.
| AnandTech Storage Bench 2013 - The Destroyer | ||
| Workload | Description | Applications Used |
| Photo Sync/Editing | Import images, edit, export | Adobe Photoshop CS6, Adobe Lightroom 4, Dropbox |
| Gaming | Download/install games, play games | Steam, Deus Ex, Skyrim, Starcraft 2, BioShock Infinite |
| Virtualization | Run/manage VM, use general apps inside VM | VirtualBox |
| General Productivity | Browse the web, manage local email, copy files, encrypt/decrypt files, backup system, download content, virus/malware scan | Chrome, IE10, Outlook, Windows 8, AxCrypt, uTorrent, AdAware |
| Video Playback | Copy and watch movies | Windows 8 |
| Application Development | Compile projects, check out code, download code samples | Visual Studio 2012 |
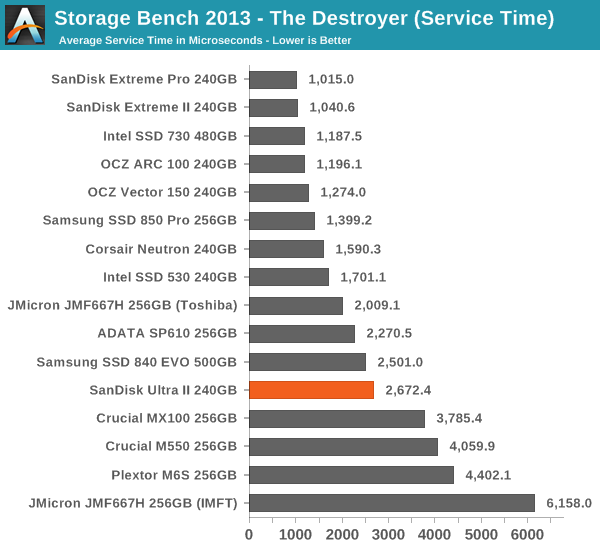
We are reporting two primary metrics with the Destroyer: average data rate in MB/s and average service time in microseconds. The former gives you an idea of the throughput of the drive during the time that it was running the test workload. This can be a very good indication of overall performance. What average data rate doesn't do a good job of is taking into account response time of very bursty (read: high queue depth) IO. By reporting average service time we heavily weigh latency for queued IOs. You'll note that this is a metric we have been reporting in our enterprise benchmarks for a while now. With the client tests maturing, the time was right for a little convergence.
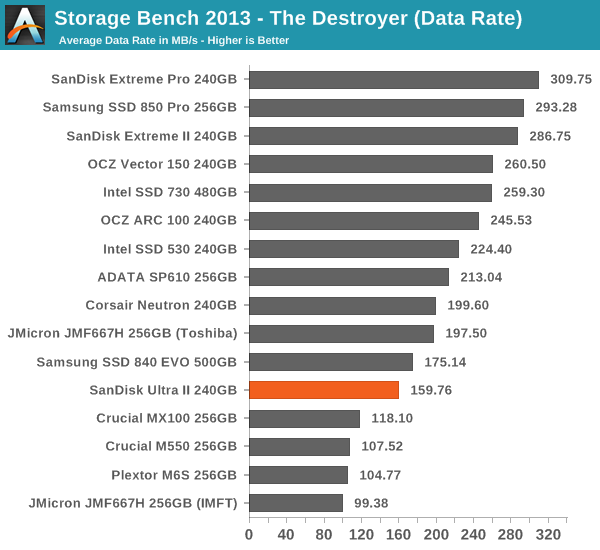
As the Ultra II is not geared towards heavy write workloads, its performance in our 2013 Storage Bench does not come as a surprise. However, it is one of the better value drives as it beats the MX100 by almost a 50% margin and is only slightly slower than the 500GB 840 EVO (unfortunately, I do not have the results for the 250GB EVO).


54 Comments
View All Comments
theuglyman0war - Thursday, September 18, 2014 - link
considering a RAID with one of the value SSD offerings. Would be nice if these reviews included RAID considerations in these reviews. ( does the SLC n-cache, or the MPR parity effect RAID perhaps? [158Gbit of usable capacity:132 of final user capacity does this effect RAID in ANY way?] )And how about a shootout between the mx100 evo 840 and ultra II in RAID configurations.
As many seem to go on about how final user experience is fine with these value SSDs I would imagine that at RAID speeds that would be doubly true? And the savings more meaningful?
steveshin10 - Friday, September 19, 2014 - link
I always saw your reviews well. Thank you.But I have a question about your TRIM Validation test.
If I want know about my SSDs Trim Performance then I only just follow your method?
What are difference "MS WHCK's Trim Performance test" and your test.
And I want know how working about the "WHSK's Trim Performance Test Workload"
Do you know that? or How can I trace (or see, or known) the "WHCK Trim Perormance Test Workload"?
Thank you.
kgh00007 - Wednesday, September 24, 2014 - link
Is TLC nand even a good idea considering what is happening to the 840 EVO and older data?I'm worried about TLC nand loosing data if it is powered off for a long time.
sirkiwi - Friday, October 24, 2014 - link
Excellent alternative to the MX100. I'll grab a Sandisk rather than a Crucial for my next build.